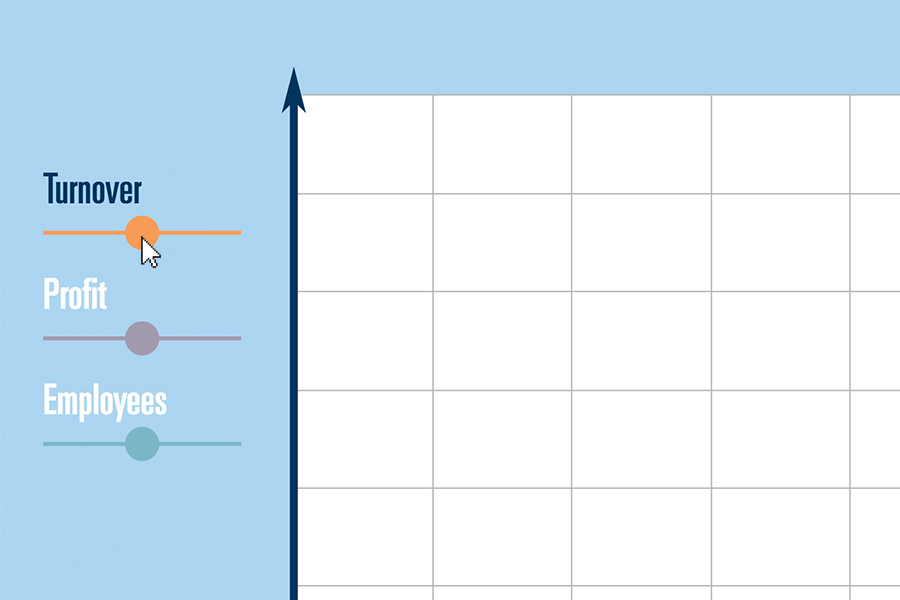
Choose a measure
When you draw your growth curve, it is important to consider the three key measures: turnover, profit and number of employees. Choose one measure at a time to focus on.
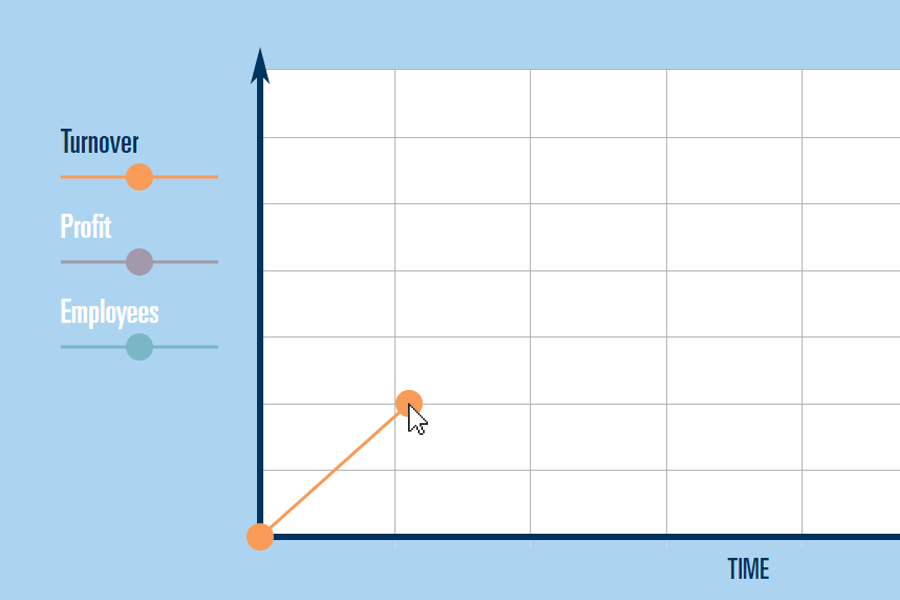
Add a marker
Select the point on the chart where you would like to place your first marker. If you make a mistake, select the marker and then REMOVE POINT to delete it.
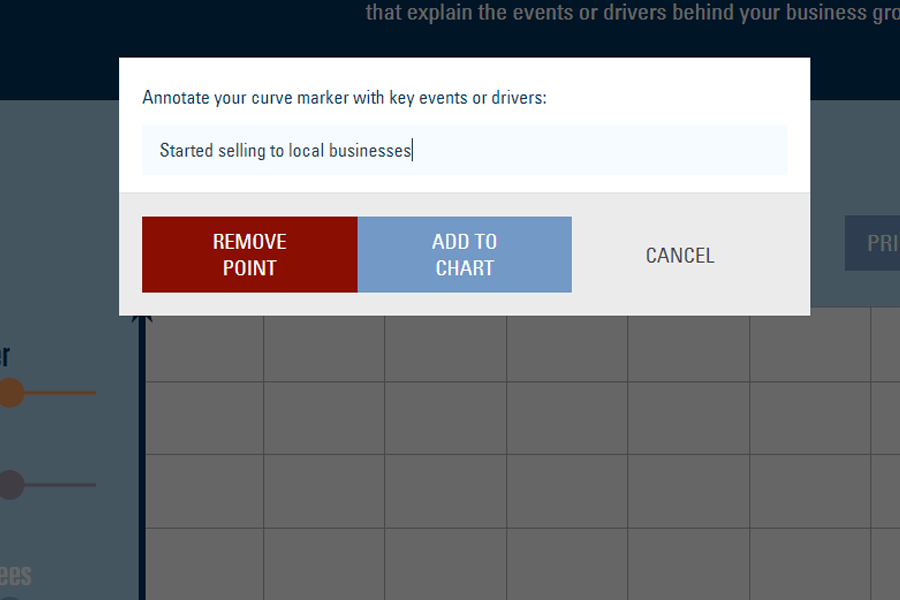
Add a comment
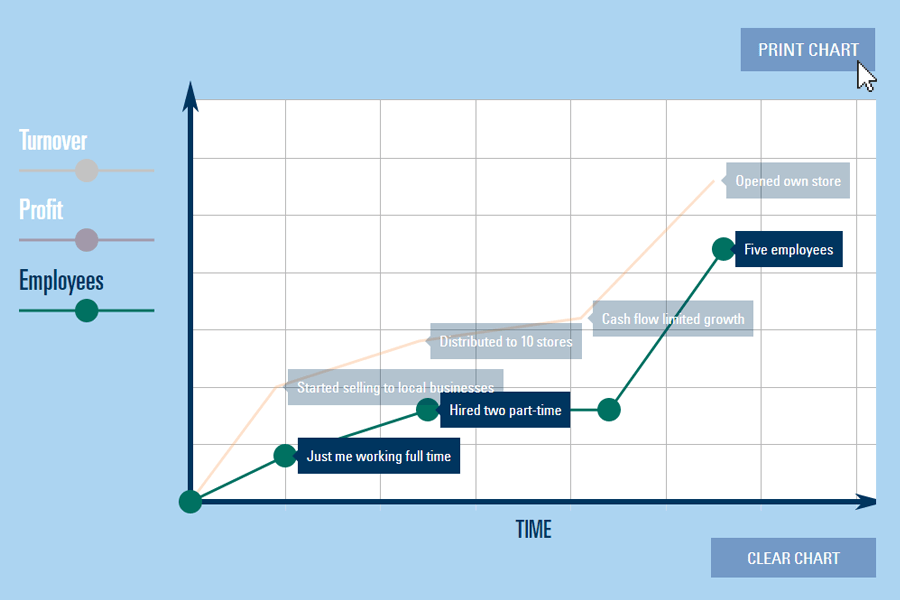
Annotate your growth curve with key events or drivers. To add a comment, select a marker and enter your text, then select ADD TO CHART. You can rewrite the comment by selecting the same marker and adding a replacement comment.
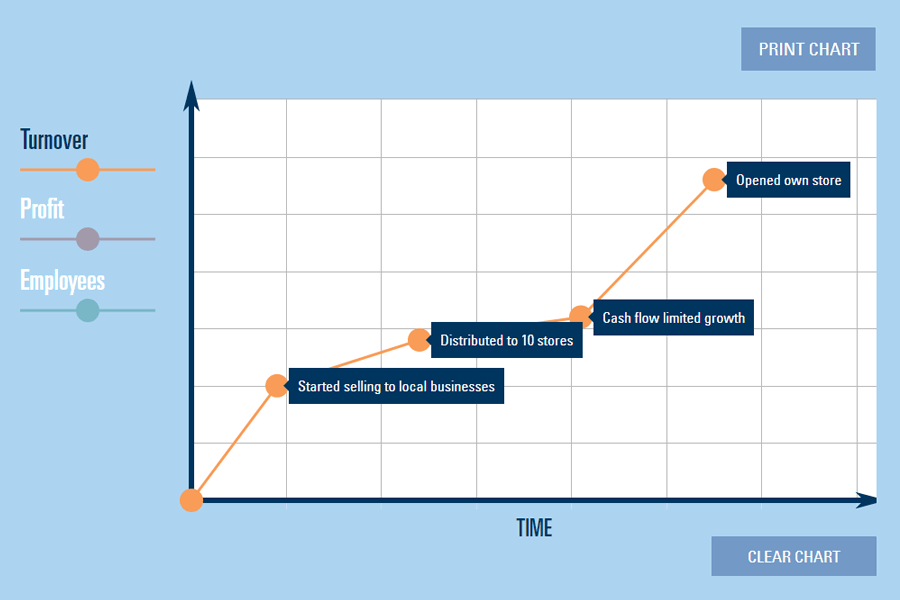
Draw your curve
Continue to place markers to create your personal growth curve. You can focus on one measure at a time, or work chronologically and switch between measures.
Download your curve
The data you submit will not be saved. Use the PRINT CHART button to print a copy or save a PDF version of your curve before you exit the interactive tool. If you are using the Coursera app on an Apple or Android device, you will need to take a screenshot to save an image of your curve.